In this article we are going to look at a few uses for low-cost sensors and how they can be combined with a time series database (TSDB) and a web front-end to easily visualize the data. For privacy reasons, I will describe a standalone use case where you have the time series database running on low-cost hardware such as a Raspberry Pi (or Chinese equivalent), so the data never leaves your house and the IoT sensors are not directly exposed to the internet.
Energy monitoring
The Sonoff POW is a $12 wireless relay that includes a power measurement IC capable of measuring energy consumption, voltage, current, etc.
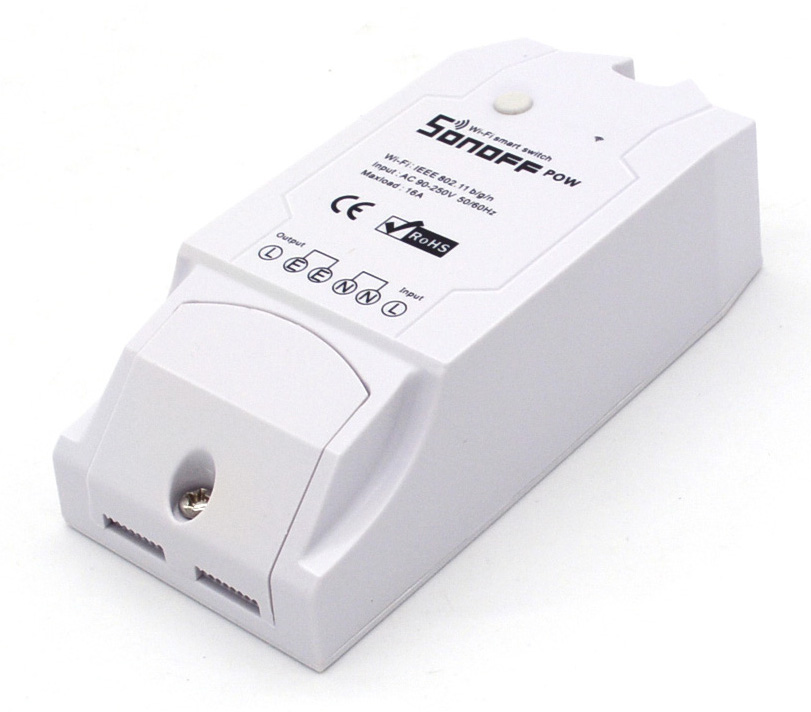
The Sonoff POW is based on the ESP8266, and there are a number of third-party firmwares available which add additional functionality like support for MQTT, InfluxDB, Domoticz, Amazon Alexa, etc. The most popular third-party seems to be ESPurna, which is what I’m using.
ESPurna is not infallible, and does occasionally crash. When that happens, the relay cycles, disrupting power to whatever is connected. Since I’m monitoring things I don’t want to be randomly power cycled, I soldered across the relay to prevent it from shutting off the loads. This turns the Sonoff POW from a wireless relay with energy monitoring to simply an energy monitor. However for my purpose that’s fine.
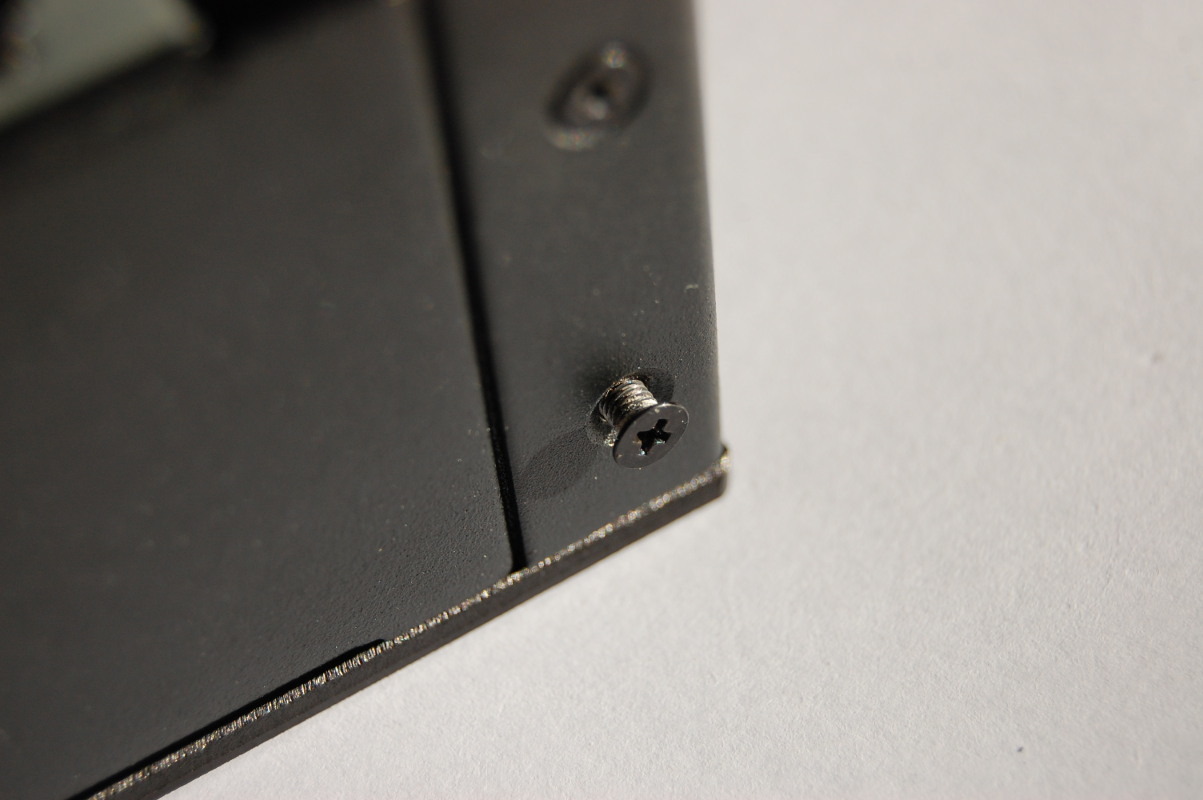
Bypassing the relay in the Sonoff POW requires opening the case and soldering across the relay. Working on the Sonoff POW should only be done when it is not connected to AC (mains power)! After soldering, you should confirm with a multimeter that you have correctly bypassed the relay and not created a short circuit. There have been several iterations of the Sonoff POW PCB, so I cannot provide universal instructions on how to bypass the relay.
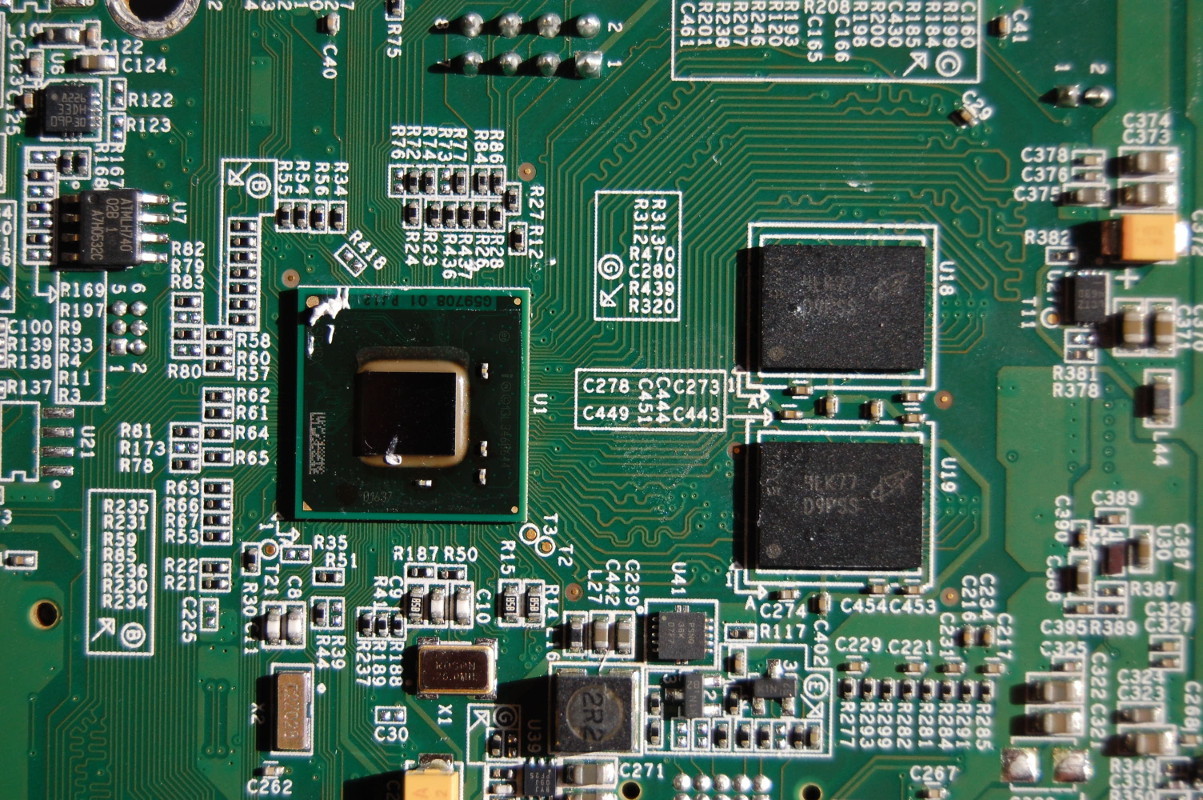
On the latest Sonoff POW hardware I own (purchased in mid-2017), you can bypass the relay by soldering a wire (shown in red) between the relay input and output:
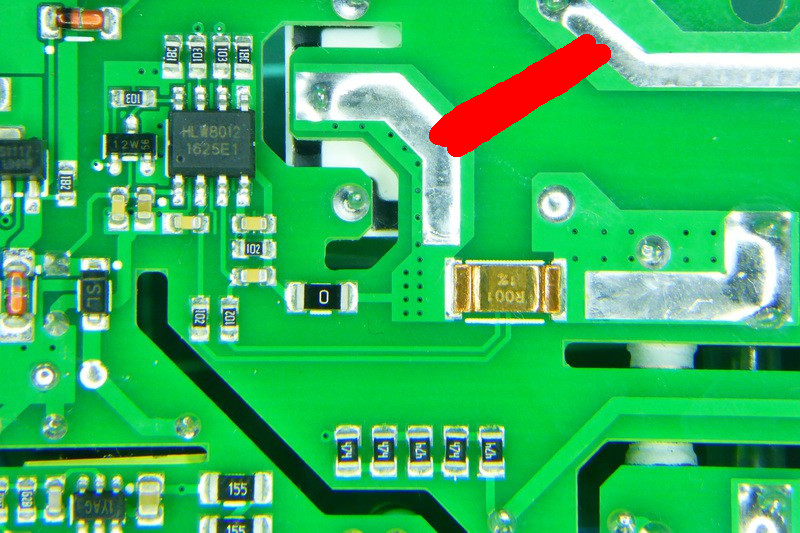
The small gold coloured object is the shunt resistor used to measure the current consumed by the load. To keep the energy monitoring functionality intact, it is important that you only solder after the shunt resistor (to the left), not before (to the right), otherwise the shunt resistor will not be in series with the load and the measured current will be 0.
Environmental monitoring
The Wemos D1 mini is a “mini WiFi board” with a large number of “shields” incorporating various sensors or other expansion options.
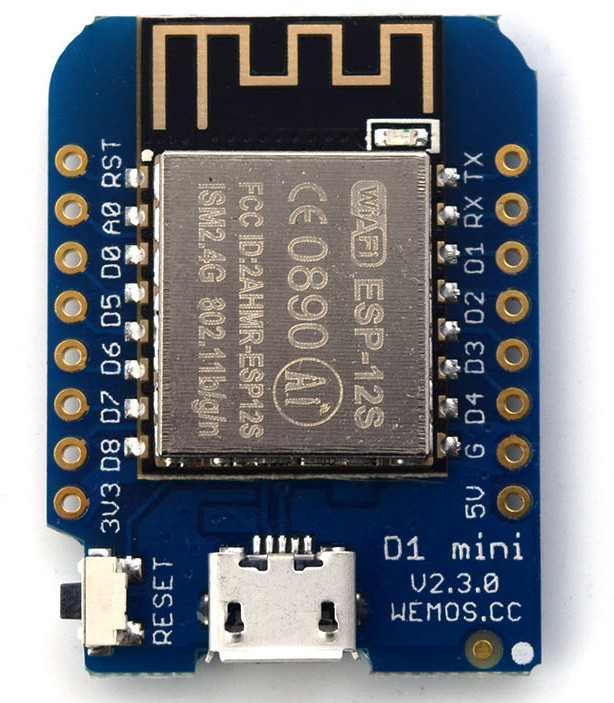
I was drawn to the Wemos D1 mini because it is supported by MicroPython as well as ESPurna (though not for my intended use case). Since there are many shields available, you can just stack modules to get the desired functionality instead of messing around on a breadboard or soldering onto protoboard.
The Wemos D1 mini is also cheap, you can buy it from China for under $3 with free shipping (at least to the EU). The modules are also quite inexpensive when ordered from China, as long as you don’t mind waiting 4-6 weeks for delivery.
- SHT30 temperature/humidity shield
- BMP180 pressure shield
- Lithium Polymer (LiPo) battery shield
- Relay shield
Since ESPurna only supports the Wemos D1 mini with the relay shield, and I wanted to do temperature/humidity/pressure monitoring, I decided to use MicroPython since it has the lowest barrier to entry. Flashing MicroPython on the Wemos D1 mini wasn’t too complicated, there is a forum thread describing how to flash it.
I created a simple python script to report the temperature and humidity to the InfluxDB server every minute. Overall it works well, the only issue I’ve run into is that there is no watchdog on the ESP8266, so if the urequests.post() fails for some reason (DNS resolution issue, packet loss, alignment of the stars) you have to manually reset the sensor using the reset button on the side.
Since these are just around my apartment, I added a “meatware monitoring” feature. When the POST is in progress, the LED on the Wemos is enabled. For a normal POST, the LED will just blink for around a second. If I walk past a sensor and notice the LED is on solid, I just press the reset button. This is not very “production ready” but I’m only monitoring the temperature and humidity for fun, so the motivation to resolve this bug is not very high. I will accept any pull requests to improve the functionality.
Time series database (TSDB)
Time series databases are a relatively new and hyped type of database, as you can probably gather from how incomplete the Wikipedia page is compared to relational databases.
For my application of 5 sensors reporting values every minute or so, there’s no reason a relational database like PostgreSQL couldn’t be used instead. But it’s helpful to learn a new technology, and InfluxDB offers some benefits over a relational database:
- Engineered for time series data
- HTTP API
- collectd API
These are only scratching the surface of InfluxDB’s features, but the HTTP and collectd APIs reduced the amount of effort needed for this project. Otherwise I would have had to write an HTTP API to accept readings and insert them into a relational database. collectd is also useful to collect performance metrics from devices running Linux or BSD, but that’s beyond the scope of what I want to discuss today.
For the Sonoff running ESPurna, there’s no additional programming required as InfluxDB is supported by default. Simply enter the URL of your InfluxDB server’s HTTP API and wait for the sensors to report readings.
Visualising the data
Now, it’s great that we can send data to InfluxDB with very little effort via the HTTP API. We can of course run queries on the data from the influx cli, however this isn’t very useful for getting a quick impression of the data.
time                value

----                -----

1512599873138880467 27.23

1512599933609113738 26.57

1512599994180436248 26.5

1512600054652895777 26.31

1512600115149476539 26.31

1512600175695516312 26.26

1512600256017317051 26.21

1512600316488957374 26.07

1512600376985207309 25.99

1512600437407006181 26.02
To visualise the data, I’ve chosen to use Grafana. Grafana is free software that you can use to visualise data from a variety of data sources such as OpenTSDB, InfluxDB, graphite, elasticsearch, and more.
Coupling Grafana with the InfluxDB data source from the Sonoff and the Wemos, we can build clever dashboards to visualise the sensor data:
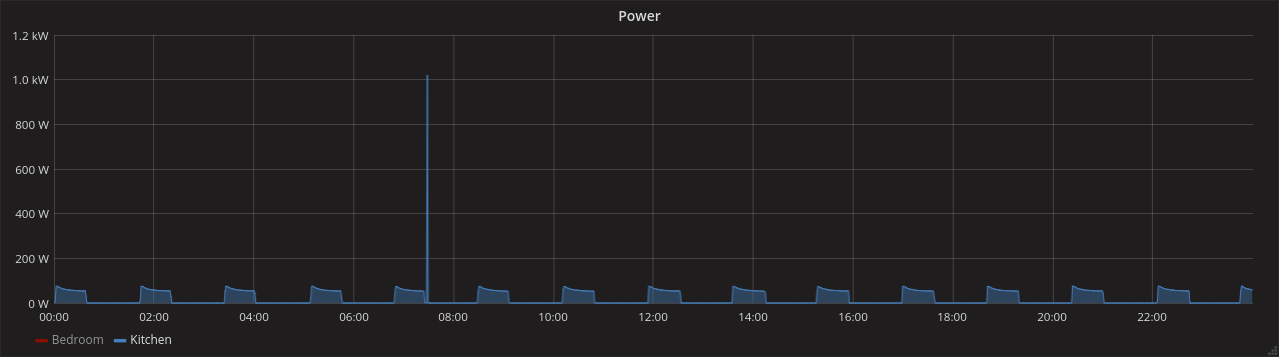
Sonoff POW monitoring a fridge and microwave, you can see where the microwave was running
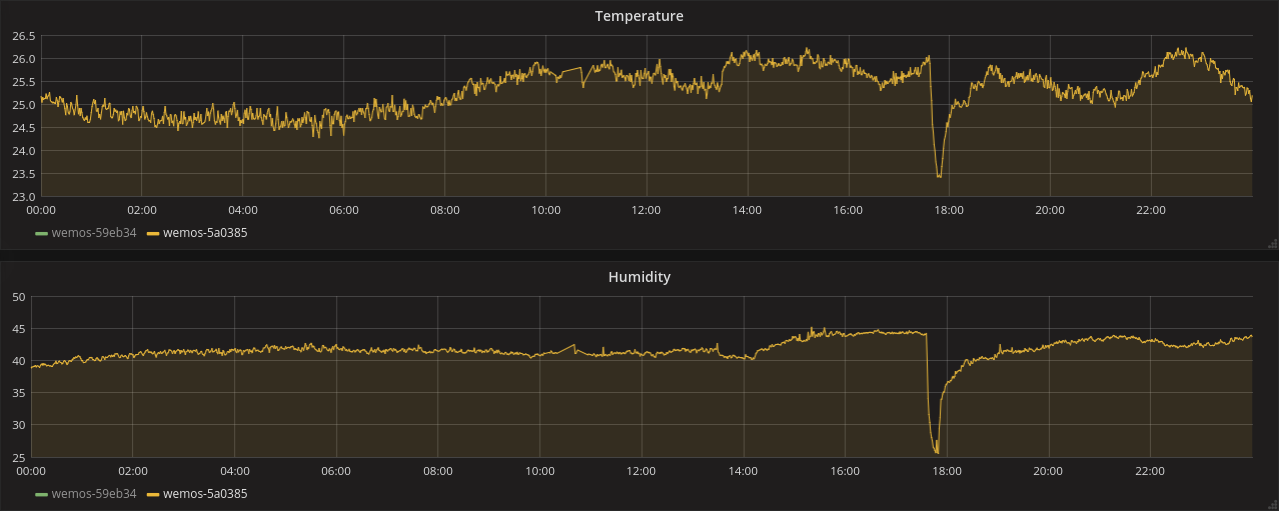
D1 Mini with SHT30 shield monitoring temperature and humidity,
can you see when the window was opened?
Security considerations
I would like to add that for security reasons if you are using any IoT devices at home, I would strongly recommend you consider isolating the devices to a separate WiFi access point and subnet to prevent them from communicating with devices on your main network. ISP supplied routers with a “Guest WiFi” mode should be capable of implementing this. Alternatively you can find inexpensive routers such as the Nexx WT3020H which support OpenWrt/LEDE and could be used to implement this.
You could in theory implement this on an SBC with WiFi supporting AP mode (such as the Orange Pi Zero), negating the need for a separate WiFi AP. However you are either faced with a SBC with very limited resources (the Orange Pi Zero has only 512MB of RAM), or an SBC with higher price than a Raspberry Pi with a WiFi router such as the Nexx WT3020H.
Tying it all together
We’ve looked at sensors, InfluxDB, and Grafana in this article. I haven’t mentioned until now that I’m running all of this on an Orange Pi PC, a small single board computer based on an Allwinner processor. For my use case, this hardware is low-energy, low-cost, and meets the performance needs of InfluxDB and Grafana.
There is nothing preventing you from running all of the above software on a different architecture (e.g. Docker on an x86). I chose ARM purely because I had the hardware available, and it is low power. If you’re building a monitoring system from scratch and your processing needs are not significant, then a SBC like the Raspberry Pi or Orange Pi PC is a very inexpensive server you can use with sensors.
I want to close by leaving some installation instructions if you are interested in implementing this yourself. This article is mostly just to inspire you to do your own projects, and is not a novel application of sensors, databases, or data visualization. So in this case, I will leave some links to other people who have written detailed instructions on how to install and configure InfluxDB and Grafana on ARM.
- Armbian (Debian for several well-known Chinese SBCs)
- Installing InfluxDB and Grafana on Raspberry Pi (instructions are also valid for other ARMv7/armhf SBCs running Debian/Armbian)
- Configuring Grafana with InfluxDB
- Running Grafana behind a reverse proxy (such as nginx with SSL)